When I prepare computer logs for my statistics courses, I usually
show how to do things in Stata and R, so students have a choice of
software. With the latest additions to markstat, I can now do this
much more easily.
Here I have revisited a page describing Cox regression models. The links below show the script and the resulting page, but you may want to read the explanation first.
The first thing to notice is that I use the Bootstrap framework. The easiest way to do this is to use “header-includes” to link to the necessary CSS and JavaScript files from a content distribution network (CDN). I also tell search engines that this page is just a copy. That’s why the script starts with
---
title: Cox Regression
author: Germán Rodríguez
date: 12 December 2017
header-includes:
 - <link rel="canonical" href="https://grodri.github.io/survival/cox"/>
 - <link rel="stylesheet" href="https://maxcdn.bootstrapcdn.com/bootstrap/3.3.0/css/bootstrap.min.css"/>
 - <script src="https://ajax.googleapis.com/ajax/libs/jquery/1.11.2/jquery.min.js"></script>
 - <script src="https://maxcdn.bootstrapcdn.com/bootstrap/3.3.0/js/bootstrap.min.js"></script>
---
The main use of the framework is to use tabs to show Stata and R versions of the page. This is actually quite easy to do. Before the very first bit of code, include the following HTML
<ul class="nav nav-tabs">
<li class="active"><a data-toggle="tab" href="#stata">Stata</a></li>
<li><a data-toggle="tab" href="#r"> R </a></li>
</ul>
<p></p>
Then, of course, you need to provide some code to switch from one language to the other. Simply include the following JavaScript at the end of your page
<script>
$(function () {
    $(".r").hide();
    $('a[data-toggle="tab"]').on('shown.bs.tab', function (e) {
        var href = $(e.target).attr("href")
        var language = href.substr(1);
        var other = language == 'r' ? 'stata' : 'r';
        $("." + other).hide();
        $("." + language).show();
    });
})
</script>
I just lifted these two fragments from a course page, where they have been
in use for a long time. These bits can be saved in separate files and injected
using .include. This is all you need for the tabs to work.
Sometimes, however, we need to include language-specific text. This we
obtain for free if we simply assign the class r or stata to text
that should appear only for that language, for example after fitting a
proportional hazards model I note
[Stata reports hazard ratios unless you specify the option `nohr`.]{.stata}
[R reports log-relative risks, but also exponentiates the coefficients to obtain
hazard ratios.]{.r}
This provides the right description for each language. The script also
has a div discussing tvc() and tvexp(), which of course applies
only to Stata.
This trick also works for images. If you want to include a Stata graph just
add the stata class to the image. Do the same for R using the r class,
as shown in the example below.
I often use the same name for the Stata and R plots, appending an r for
the R version. For example the main Cox-Kaplan-Meier plot is called coxkm.png
in the Stata version and coxkmr.png in the R version.
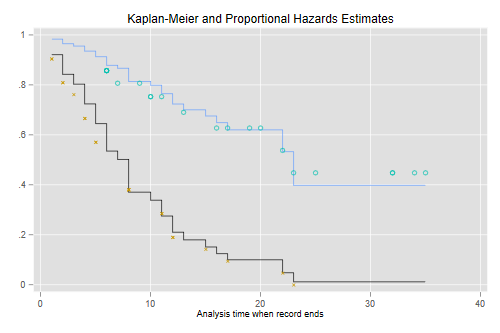{.stata .img-responsive .img-center}
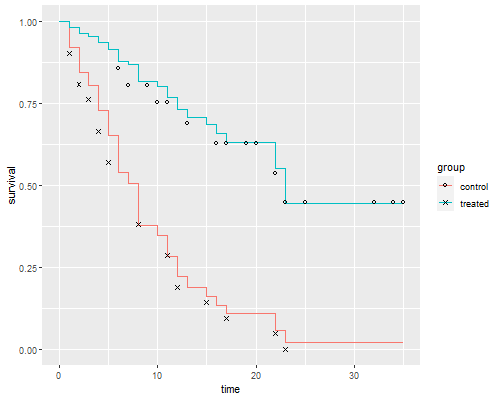{.r .img-responsive .img-center}
Each plot will show only when the corresponding tab is selected. I also
use the img-responsive class to make the image responsive to different
device sizes, and img-center to center it.
If an image is in a paragraph by itself and has a caption, Pandoc will
wrap it in <figure> tags and add a <figcaption>. To ensure that all
elements are shown or hidden you need to wrap the image using colon
fences and assign the language class to that:
:::{.stata}
{.img-responsive .img-center}
:::
I did not use this technique in this example, as none of the images have Markdown captions.
By the way, if you are wondering how I got the Stata plots to look like
R’s ggplot2, read about the plottig scheme in the Stata Journal
17-3 or type search plottig. And if you are wondering how I got
generic grid plots in R to look somewhat like ggplot2, look at the
ggfy() function in a quiet R block near the top of the script.
That’s it, really. Follow the links at the top to see the script and the resulting web page, which differs from the “official” page only on the surrounding website “chrome”.
New in markstat 2.1