Here is a simple script drawing a graph and running a regression, using Markdown annotations and Stata code indented four spaces:
auto.stmd
% Dynamic Documents with Stata and Markdown
% Germán Rodríguez, Princeton University
% 4 November 2017
Let us read the fuel efficiency data that ships with Stata
sysuse auto, clear
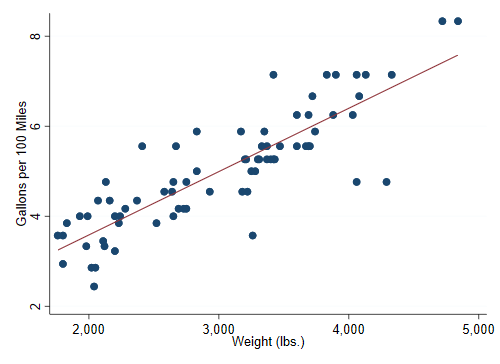
To study how fuel efficiency depends on weight it is useful to
transform the dependent variable from "miles per gallon" to
"gallons per 100 miles"
gen gphm = 100/mpg
We then obtain a fairly linear relationship
twoway scatter gphm weight || lfit gphm weight, ///
ytitle(Gallons per 100 Miles) legend(off)
graph export auto.png, width(500) replace
The regression equation estimated by OLS is
regress gphm weight
Thus, a car that weighs 1,000 pounds more than another requires
on average an extra 1.4 gallons to travel 100 miles.
That's all for now!
And this is how it is rendered using the command markstat using auto
auto.htmlIf you add the pdf option, you will obtain the pdf file seen
here. If you use the option docx instead, you will obtain
the Word document seen here. By the way this is basically
the example in the markstat help file.