4 November 2017
Let us read the fuel efficiency data that ships with Stata
. sysuse auto, clear
(1978 automobile data)
To study how fuel efficiency depends on weight it is useful to
transform the dependent variable from “miles per gallon” to “gallons per 100 miles”
. gen gphm = 100/mpg
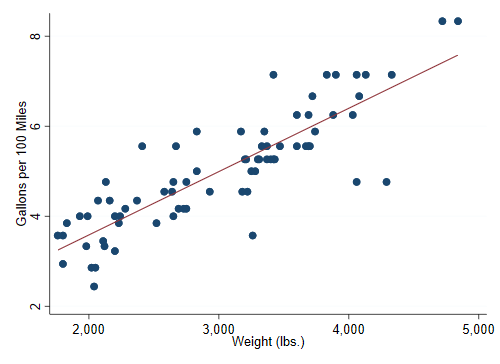
We then obtain a fairly linear relationship
. twoway scatter gphm weight || lfit gphm weight,  ///
>     ytitle(Gallons per 100 Miles) legend(off)

. graph export auto.png, width(500) replace
file auto.png saved as PNG format
The regression equation estimated by OLS is
. regress gphm weight

      Source │       SS           df       MS      Number of obs   =        74
─────────────┼──────────────────────────────────   F(1, 72)        =    194.71
       Model │  87.2964969         1  87.2964969   Prob > F        =    0.0000
    Residual │  32.2797639        72  .448330054   R-squared       =    0.7300
─────────────┼──────────────────────────────────   Adj R-squared   =    0.7263
       Total │  119.576261        73  1.63803097   Root MSE        =    .66957

─────────────┬────────────────────────────────────────────────────────────────
        gphm │ Coefficient  Std. err.      t    P>|t|     [95% conf. interval]
─────────────┼────────────────────────────────────────────────────────────────
      weight │    .001407   .0001008    13.95   0.000      .001206    .0016081
       _cons │   .7707669   .3142571     2.45   0.017     .1443069    1.397227
─────────────┴────────────────────────────────────────────────────────────────
Thus, a car that weighs 1,000 pounds more than another requires on average an extra 1.4 gallons to travel 100 miles.
That’s all for now!