PDF Files
Stata 15 has a putpdf command that can automate the production of PDF files using low-level instructions. The markstat command can achieve equivalent results using Markdown to author the document.
The example below, taken from Stata 15’s announcement of putpdf, shows the code in samplereport.do and the equivalent markstat script, which reproduces all results but skips changing the background color of text1.
// Stata's samplereport.do
sysuse auto, replace

putpdf begin

// Create a paragraph
putpdf paragraph
putpdf text ("putpdf "), bold
putpdf text ("can add formatted text to a paragraph.  You can ")
putpdf text ("italicize, "), italic
putpdf text ("striketout, "), strikeout
putpdf text ("underline"), underline
putpdf text (", sub/super script")
putpdf text ("2 "), script(sub)
putpdf text (", and   ")
putpdf text ("bgcolor"), bgcolor("blue")
qui sum mpg
local sum : display %4.2f `r(sum)'
putpdf text (".  Also, you can easily add Stata results to your paragraph (mpg total = `sum')")

// Embed a graph
histogram rep
graph export hist.png, replace
putpdf paragraph, halign(center)
putpdf image hist.png

// Embed Stata output
putpdf paragraph
putpdf text ("Embed the output from a regression command into your pdf file.")
regress mpg price
putpdf table mytable = etable

// Embed Stata dataset
putpdf paragraph
putpdf text ("Embed the data in Stata's memory into a table in your pdf file.")
statsby Total=r(N) Average=r(mean) Max=r(max) Min=r(min), by(foreign): summarize mpg
rename foreign Origin
putpdf table tbl1 = data("Origin Total Average Max Min"), varnames  ///
        border(start, nil) border(insideV, nil) border(end, nil)

putpdf save myreport.pdf, replace
Create PDF
==========
```s/
quietly sysuse auto, replace
quietly sum mpg
local sum = r(sum)
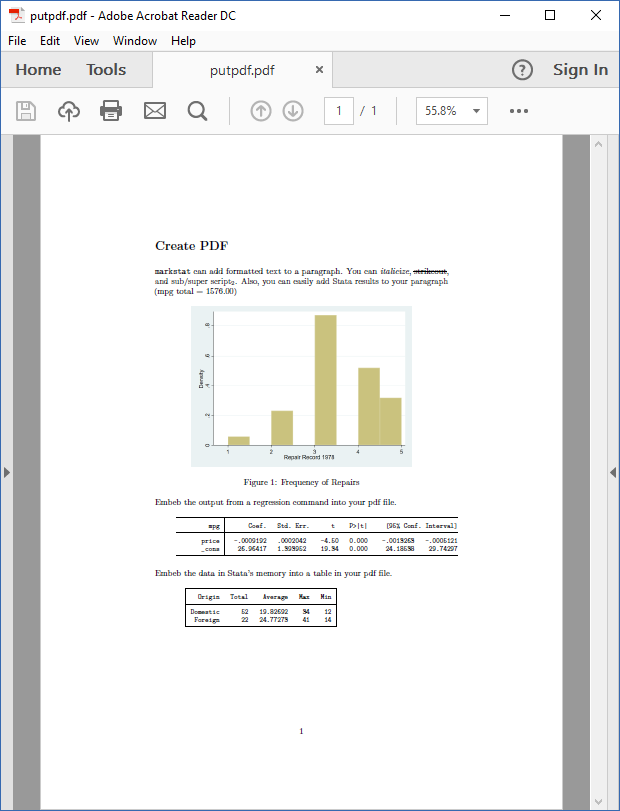
quietly histogram rep
quietly graph export hist.png, replace
```
`markstat` can add formatted text to a paragraph. You can *italicize*,
~~strikeout~~, and sub/super script~2~.
Also, you can easily add Stata results to your paragraph
(mpg total = `s %4.2f `sum'`)

Embeb the output from a regression command into your pdf file.
```s/
quietly regress mpg price
_coef_table
```
Embeb the data in Stata's memory into a table in your pdf file.
```s/
quietly statsby Total=r(N) Average=r(mean) Max=r(max) Min=r(min), ///
by(foreign): summarize mpg
rename foreign Origin
list Origin Total Average Max Min, noobs
```
This example is not very representative because it doesn’t have a lot of text. The output of putpdf is available from the Stata website
here.
The output from markstat is here,
with a reduced screen capture below. The input script is here.
[1] The background color can be changed in HTML using the Markdown syntax
[bgcolor]{style="background-color:rgba(0,0,255, 0.3)"} or a span tag,
and in PDF by using LaTeX code as shown
here with output here.
In both cases I changed the opacity of the blue background to make the black
text more readable than in Stata’s original.