Dynamic Presentations
markstat 2.0 leverages the amazing Pandoc to support presentations in
HTML using the S5 engine, or in PDF via LaTeX using Beamer. Here is a
simple four-slide example. It starts with metadata to define the title,
author and date, which are used to generate a title slide. Each heading
at level 1 then defines a slide. The rest is pretty self-explanatory.
deck.stmd
% Dynamic Presentations with Stata and Markdown
% Germán Rodríguez, Princeton University
% 7 November 2017
# Bullet Points
You presentation will usually include bullet points:
+ Estimation methods
+ Stata output
+ Stata graphs
These can be shown incrementally.
The same script can generate an HTML presentation using
the S5 engine, or PDF slides via LaTeX using Beamer.
# Stata Output {.fragile}
Here's the proverbial fuel efficiency dataset:
sysuse auto, clear
gen gphm = 100/mpg
quietly reg gphm weight
_coef_table
So a car that weights 1,000 pounds more than another will need on average
`s %5.1f 1000*_b[weight]` more gallons to travel 100 miles.
# Stata Graphs {.fragile}
Using gallons per 100 miles leads to a more linear relationship
twoway scatter gphm weight || lfit gphm weight, ///
legend(off) ytitle(Gallons per 100 miles)
quietly graph export gphm.png, width(800) replace
{width="55%"}
# Notes on Features
This example uses the simple syntax, with Stata code indented one tab
or four spaces.
If you get carried away with nested lists, or wish to hide code, you
can use the strict syntax.
As usual, you can include math formulas and/or bibliographic references.
The fragile attribute is used to keep Beamer happy with verbatim blocks,
and is ignored in HTML
A `nodo` option let's you tweak the narrative or change engines and/or themes
without having to rerun the Stata code, an idea from Ben Jann's `texdoc`.
Save the script as deck.stmd in the current working directory. Or
download the script from this website using the Stata command:
copy https://grodri.github.io/markstat/deck.stmd .
Issuing the command markstat using deck, slides will produce the HTML
presentation using the S5 engine shown here.
Changing the option to slides(santiago) uses the new Santiago theme
instead, as shown here. This theme works
better with multi-part presentations. In both cases, adding the bundle
option results in a self-contained presentation that includes all
images, css and JavaScript files. Here are the title pages for both
themes:
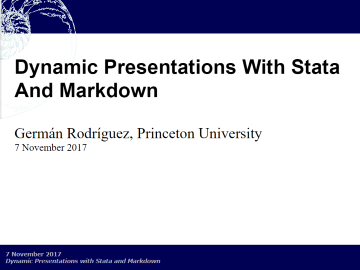
S5 Default
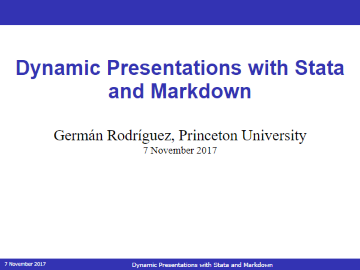
S5 Santiago
S5 slides also have a printer-friendly outline mode, that you can reach by hovering on the bottom right for the default theme, top right for the Santiago theme, and clicking on [∅]. You will also see navigation arrows and a combo box to jump directly to any given slide.
Is you have a LaTeX installation you can issue the command
markstat using deck, beamer to generate a Beamer presentation using
the default theme, as shown here.
Change the option to beamer(madrid) to use the Madrid theme, with
the results shown here. You can use any of the many
Beamer themes available. A nice theme gallery may be found
here. Here are the title
pages for both themes:
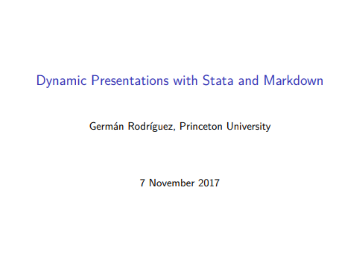
Beamer Default
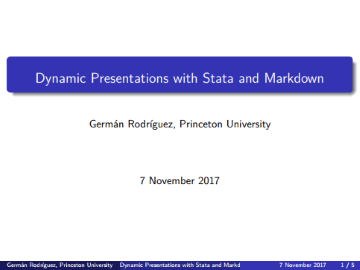
Beamer Madrid
Tinkering with engines and/or themes is facilitated by the nodo
option, which lets you change the narrative or the style of the
presentation, without having to rerun the Stata code generating the
images and tables.
For best results I recommend you install the latest version of Pandoc,
available at
pandoc.org/installing.html. The
examples linked here were first ran with markstat 2.0.1 using Pandoc
2.0.1.1.
For another example see two-column slides.
Note: You may wonder how I produced four files with different names
from the same script, when markstat uses the name of the script for
all output files.
A simple hack: after each run I copied the output file, for example
copy deck.html santiago.html, or copy deck.pdf madrid.pdf.
New in markstat 2.0