dyndoc and markstatHere is a comparison based on the first example in my paper “Literate Data Analysis with Stata and Markdown”
available here.
You’ll first see the equivalent script using Stata 15’s dyndoc, which produces the output shown here. (The style could be changed by including a header with a CSS file.)
If you click on the markstat tab you will see the original script, using plain Stata and Markdown code with the simple indentation rule.
This produces the output shown here, which uses a built-in CSS.
(More complex examples requiring hiding commands would use the strict rule.) .
IMHO the markstat version is closer to the spirit of Markdown, easy to read and easy to write, “without looking like it’s been marked up with tags or formatting instructions” (Gruber, 2004)
<<dd_version: 1.0>>

Stata Markdown
==============

Let us read the fuel efficiency data that is shipped with Stata

~~~~
<<dd_do>>
sysuse auto, clear
<</dd_do>>
~~~~

To study how fuel efficiency depends on weight it is useful to
transform the dependent variable from "miles per gallon" to
"gallons per 100 miles"

~~~~
<<dd_do>>
gen gphm = 100/mpg
<</dd_do>>
~~~~

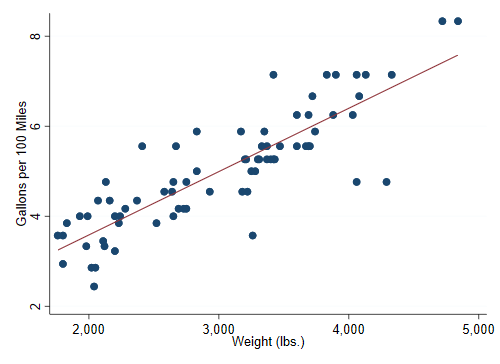
We then obtain a more linear relationship

~~~~
<<dd_do>>
twoway scatter gphm weight || lfit gphm weight ///
    , ytitle(Gallons per Mile) legend(off)
<</dd_do>>
~~~~

<<dd_graph: saving(auto.png) width(500) replace>>

The regression equation estimated by OLS is

~~~~
<<dd_do>>
regress gphm weight
<</dd_do>>
~~~~

Thus, a car that weighs 1,000 lbs more than another requires on
average an extra <<dd_display: %5.1f 1000*_b[weight]>> gallons to travel
100 miles.

That's all for now!
Stata Markdown
==============
Let us read the fuel efficiency data that is shipped with Stata
sysuse auto, clear
To study how fuel efficiency depends on weight it is useful to
transform the dependent variable from "miles per gallon" to
"gallons per 100 miles"
gen gphm = 100/mpg
We then obtain a more linear relationship
twoway scatter gphm weight || lfit gphm weight ///
, ytitle(Gallons per Mile) legend(off)
graph export auto.png, width(500) replace

The regression equation estimated by OLS is
regress gphm weight
Thus, a car that weighs 1,000 lbs more than another requires on
average an extra `s %5.1f 1000*_b[weight]` gallons to travel
100 miles.
That's all for now!