
The file us2013s.dat has two columns representing age and the survival function by single years of age, for ages 0 to 110. The data come from the 2013 period life table for the U.S. I downloaded them from www.mortality.org, which seems more user-friendly than the National Center for Health Statistics, the original source.
Here’s how to read and plot the survival function, and how to compute and plot the (log of the) hazard function.
. insheet using https://grodri.github.io/datasets/us2013s.dat, ///
> delim(" ") case clear
(2 vars, 111 obs)
. gen H = -log(S)
. gen agem = age + 0.5
. gen h = H[_n+1] - H
(1 missing value generated)
. gen logh = log(h)
(1 missing value generated)
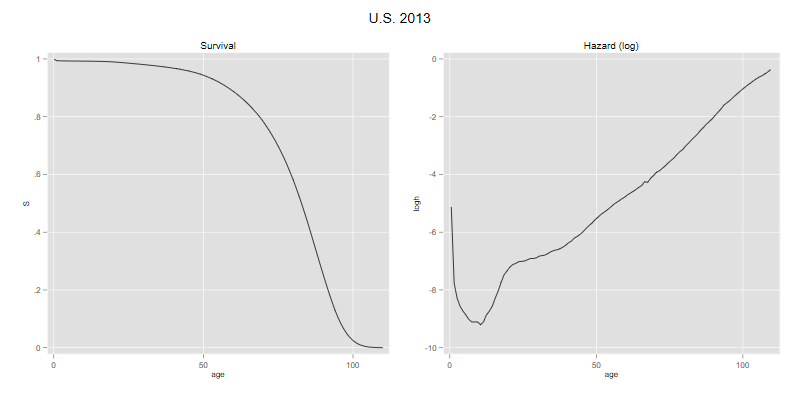
. line S age, name(p1, replace) title(Survival)
. line logh agem, xtitle("age") name(p2, replace) title("Hazard (log)")
. graph combine p1 p2, xsize(8) ysize(4) title("U.S. 2013")
. graph export us2013.png, width(800) height(400) replace
file us2013.png saved as PNG format
> library(dplyr)
> library(ggplot2)
> library(gridExtra)
> us <- read.table("https://grodri.github.io/datasets/us2013s.dat", header=TRUE)
> us <- mutate(us,
+ H = -log(S),
+ agem =age + 0.5,
+ h = c(diff(H), NA),
+ logh=log(h))
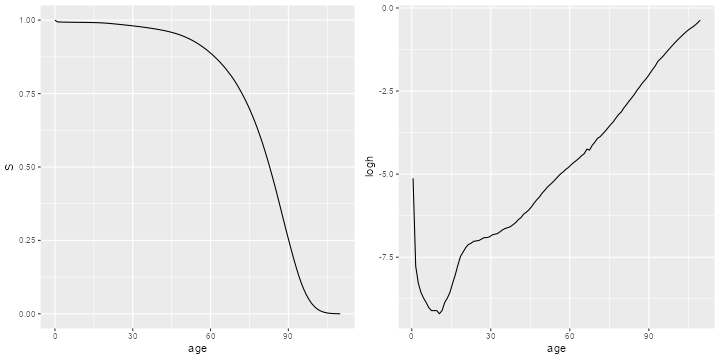
> g1 <- ggplot(us, aes(x=age, y=S)) + geom_line()
> g2 <- ggplot(slice(us,-n()), aes(x=agem, y=logh)) + geom_line() + xlab("age")
> g <- arrangeGrob(g1, g2, ncol=2)
> ggsave("us2013r.png", plot=g, width=10, height=5, dpi=72);
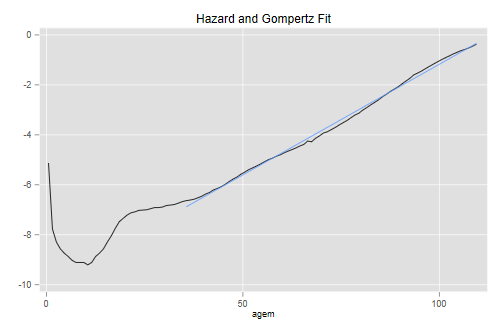
The Gompertz distribution provides a remarkably close fit to the hazard at adult ages, as one would expect from the linearity of the graph. Here’s a visual check of the fit at ages above 35:
. line logh agem || lfit logh agem if agem > 35, ///
>     title("Hazard and Gompertz Fit") legend(off)

. graph export us2013g.png, width(500) replace
file us2013g.png saved as PNG format
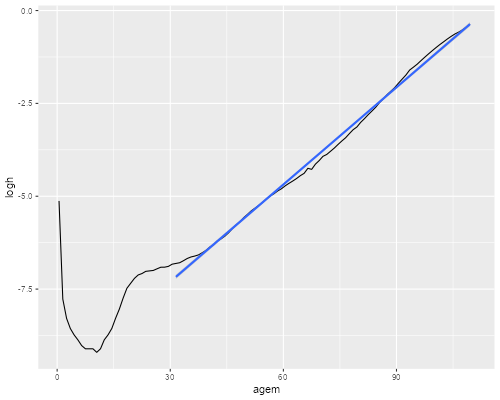
>  adults <- filter(us, age > 30, age < 110)
> ggplot(us, aes(x=agem, y=logh)) + geom_line() +
+     stat_smooth(data=adults,method="lm")
> ggsave("us2013gr.png", width=500/72, height=400/72, dpi=72)
The U.S. survival function for 2002 is here, in a file that has age and S but no header. How much has the hazard function changed between 2002 and 2013?