In class we have illustrated the use of MLwiN using the Graphical User Interface (GUI). For serious work you should (1) log the results, and (2) use the Command Interface so you can store all your commands on a file and ensure that you can reproduce your results at a later time. The online help has a useful section on Using the command interface. Here are some hints.
The command logofilename logs the
results on a file. You can turn this feature on using
logo 1 and off using logo 0. You must use the
last command to ensure that the log file is closed properly.
To log commands as well as results turn echo on using
echo 1. Note that if you read data and echo is on, the
entire dataset will be listed. For best results set echo 0
before reading data and echo 1 afterwards.
Here’s how to read the data from Snijders and Bosker (1999),
henceforth SB, that we have been using in class. Because MLwiN works
with local files I copied the data and scripts to d:. Make sure you use
the correct local or network filename for you. I also use
put to generate a vector of ones and name to
assign variable names.
It is usually a good idea to compute means or other summary statistics to ensure you read the data OK.
echo 0
dinput c1-c4
d:\temp\snijders4.dat
echo 1
put 2287 1 c5
name c1 "school" c2 "pupil" c3 "iqverb" c4 "langpost" c5 "one"Here’s how to define the level id’s and the response variable, and
how to fit a simple variance components model with constant variation at
levels 1 and 2. All explanatory variables must be declared using
expl and are automatically added to the fixed part. The
random structure is declared using setv. I use
settings to ensure all is well.
iden 1 "pupil" 2 "school"
response "langpost"
explanatory 1 "one"
setv 1 "one"
setv 2 "one"
settings
The feedback of the last command is shown below:
settings
EXPLanatory variables in       one
FPARameters                    one
RESPonse variable in           langpost
FSDErrors : uncorrected                 RSDErrors : uncorrected
MAXIterations  20   TOLErance     2     METHod is IGLS    BATCh is OFF
IDENtifying codes : 1-pupil, 2-school

LEVEL 2 RPM
         one
one      1
LEVEL 1 RPM(RESETTING OFF)
         one
one      1
To fit a model using a macro file you must set batch mode on by using
bath 1, otherwise you get only one iteration. To list
results use fixed and random.
batch 1
start
fixed
random
The output is shown below, just below each command
batch 1

Batch mode is ON
start

Convergence achieved
fixed


  PARAMETER            ESTIMATE     S. ERROR(U)   PREV. ESTIMATE
one                       40.36       0.4263              40.36
random
LEV.  PARAMETER       (NCONV)    ESTIMATE    S. ERROR(U)  PREV. ESTIM     CORR.
-------------------------------------------------------------------------------
 2    one      /one      ( 1)       19.42          2.921        19.34         1
-------------------------------------------------------------------------------
 1    one      /one      ( 2)       64.57          1.967        64.58
These are the results in SB-Table 4.1.
To fit a random-intercept model we use expl 1 to add an
explanatory variable:
expl 1 "iqverb"
start
fixed
random
This is the output, again with results following each command:
expl 1 "iqverb"
start

Convergence achieved
fixed


  PARAMETER            ESTIMATE     S. ERROR(U)   PREV. ESTIMATE
one                       11.17       0.8788              11.16
iqverb                    2.488      0.07005              2.488
random
LEV.  PARAMETER       (NCONV)    ESTIMATE    S. ERROR(U)  PREV. ESTIM     CORR.
-------------------------------------------------------------------------------
 2    one      /one      ( 1)       9.496          1.515        9.486         1
-------------------------------------------------------------------------------
 1    one      /one      ( 2)       42.23          1.286        42.23
This is the parallel lines model in SB-Table 4.2.
To make the slope of verbal IQ random at the school level we use
setv specifying the level and variable name. I also use
like to print the likelihood
setv 2 "iqverb"
start
fixed
random
Here’s the output
setv 2 "iqverb"
start
Convergence achieved
fixed
PARAMETER ESTIMATE S. ERROR(U) PREV. ESTIMATE
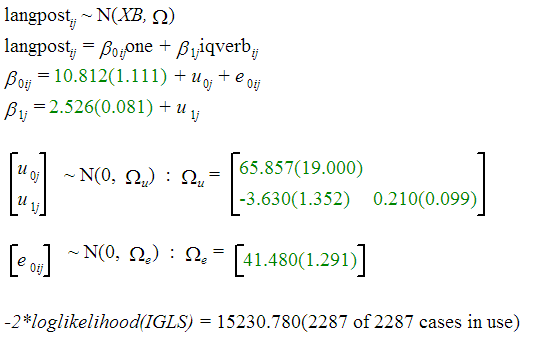
one 10.81 1.111 10.81
iqverb 2.526 0.08145 2.526
random
LEV. PARAMETER (NCONV) ESTIMATE S. ERROR(U) PREV. ESTIM CORR.
-------------------------------------------------------------------------------
2 one /one ( 2) 65.86 19 65.82 1
2 iqverb /one ( 1) -3.63 1.352 -3.628 -0.976
2 iqverb /iqverb ( 1) 0.21 0.09914 0.2099 1
-------------------------------------------------------------------------------
1 one /one ( 3) 41.48 1.291 41.48
likelihood
979232 spaces left on worksheet
-2*log(lh) is 15230.8The same results in the equation window look like this: